Sexual orientation data was unknown for 30% of all suicide deaths reported to WVDRS. In addition, WVDRS does not include data on gender identity, such as transgender. From 2013–2017, 55 suicide deaths were reported as lesbian, gay, or bisexual (LGB). Of those, 20 were reported as being lesbian, 22 as gay, and 13 as bisexual.7 However, undercounting is possible due to the difficulty of coroners and medical examiners obtaining sexual orientation information for many suicide deaths. The following data are based on the 55 LGB suicide deaths and compared to cases reported as heterosexual.
Compared to heterosexuals, LGB individuals died from suicide at a younger age. The average age of suicide deaths among LGB individuals was 32 compared to heterosexuals whose average age of suicide death was 46. LGB individuals were also significantly more likely to use hanging as the method of suicide and significantly less likely to use a firearm. The majority of LGB individuals who died by suicide were reported as being white (87%).
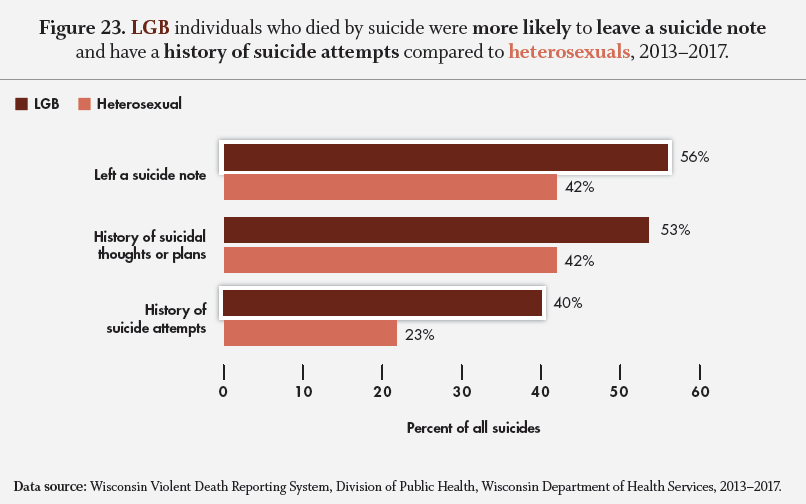
Figure 23. LGB individuals were significantly more likely to leave a suicide note and have a history of suicide attempts. A history of suicidal thoughts and plans was not significantly different when comparing LGB and heterosexual individuals.
7. Data from WVDRS is shown for sexual orientation only (LGB). Data from the 2017 YRBS includes sexual orientation and gender identity (LGBT).
Although information on sexual orientation and gender identity from surveillance data is relatively limited, other data sources, including national surveys and the Youth Risk Behavior Survey (YRBS), provide additional insight into the suicidal behaviors experienced by LGBT individuals. For instance, one study found that 40 percent of transgender people attempted suicide sometime in their lifetime, and of those who attempted, 73 percent made their first attempt before the age of 18.8
Additionally, LGBT youth report the following risk factors in the YRBS:
- Less sense of school belonging: LGBT students are less likely to feel supported and connected to their school. They are twice as likely as other students to say they do not feel like they belong at their school.
- Lack of supportive adults: LGBT youth are the least likely group to have a supportive adult at school. About 58% say they do not have one teacher or other adult at school they can talk to if they have a problem compared to 28% of heterosexual youth.
- Bullying: LGBT students are 50% more likely than their peers to have been bullied at school or online.
- Mental health: LGBT students report higher rates of depression and anxiety. 1 in 2 LGBT students reports depression compared to approximately 1 in 4 heterosexual peers.